The best dashboards are built with code.
Observable offers a modern way to create and host powerful, performant data apps.
Use Markdown, JavaScript and SQL, Python, R, or any other language you choose.
Get our open-source framework
npm init "@observablehq"A workflow tailored to data apps
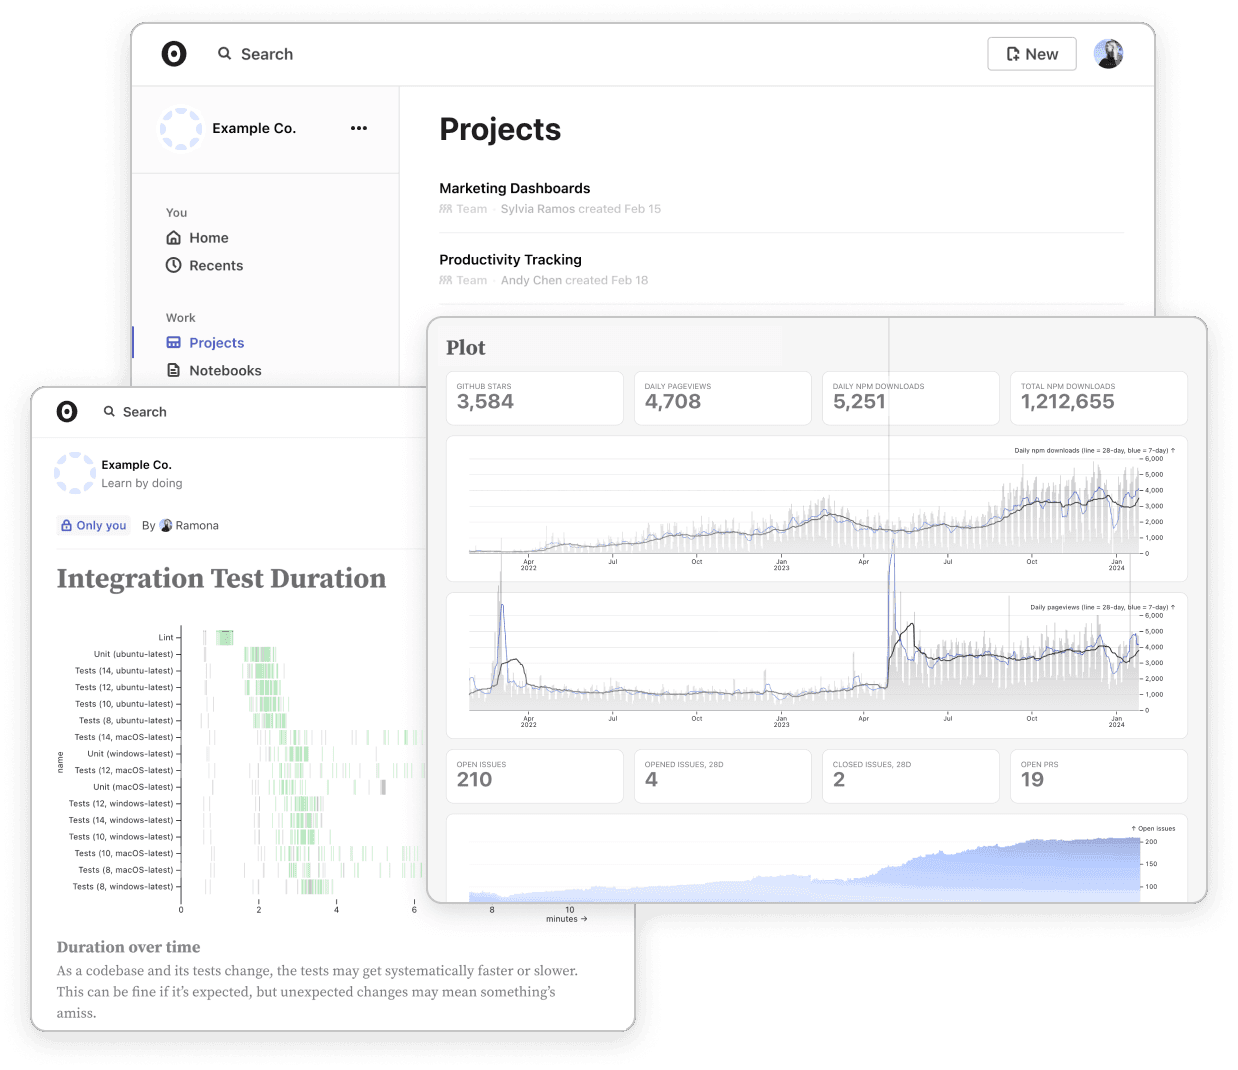
Developers at the world’s leading companies choose Observable’s end-to-end platform to build and share data apps, dashboards, and reports.
Developers at the world’s leading companies choose Observable’s end-to-end platform to build and share data apps, dashboards, and reports.


Develop and deploy data apps the modern way
Build locally, your way
The open source Observable Framework uses a file-based workflow. Code in your preferred editor and check everything into git. You can even develop and preview offline.
Any language, any library
Load and transform your data in Python, SQL, R, and more. Then tap into the full capabilities of the browser to display data with JavaScript in the client. It’s the best of all worlds.
Instant dashboards
Slow queries and timeouts are the bane of dashboard viewers. Observable takes snapshots of data during build so dashboards load instantly. Say goodbye to spinners.
Continuous deployment
Bring CI/CD to your dashboards and data apps. Test before you ship, use automatic deploy-on-commit, and ensure displays of data are always up-to-date. Self-manage scheduled builds and deploy to Observable or self-host.
Purpose-built for data apps

When launching ChatGPT, our team at OpenAI leveraged Observable to craft and disseminate crucial visual charts that proved invaluable when showcasing our developmental processes and features to a broad audience with ease.
When launching ChatGPT, our team at OpenAI leveraged Observable to craft and disseminate crucial visual charts that proved invaluable when showcasing our developmental processes and features to a broad audience with ease.

Leaders in data visualization
Leaders in data visualization
From the creators of D3 and Observable Plot, our solution is trusted by hundreds of thousands of data practitioners. Learn best practices and discover new ways of presenting data with useful templates and examples from our team and our community.

Loved by developers
Loved by developers
I'm getting happy tears every time I see the data files getting regenerated when data loaders change
Youssef A
Beautiful interface, love this product
Lena D